


PRODUCT LIST


DATACENTER CATEGORIES


")
")
InfraSuite Manager - Data Center Infrastructure Management (DCIM)
")
Product Modules
|
|
Operation Platform (Base Model) |
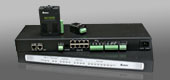
The Operation base model of InfraSuite Manager (EMS3000) is the basic platform that shows real-time device alerts and the datacenter floor plan with graphs. It can also provide real-time suggestions to assist datacenter managers for proper reactions.
The Operation base model provides the fundamental DCIM platform. Extensional function modules can be added according to the demand of the enterprise or organization. This system also supports integration with third-party devices.
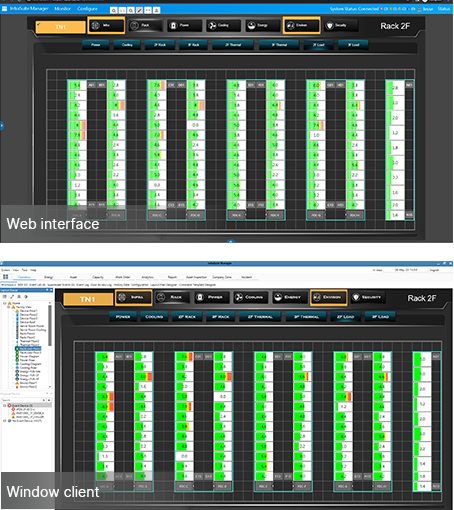
- Diverse layout components to design the floor plans in a single project for both web and Windows application interfaces.
- Organizational privilege access to reduce human error.
- Built-in report generator tool allows for customization to individual business needs.
Monitor All Equipment
|
|
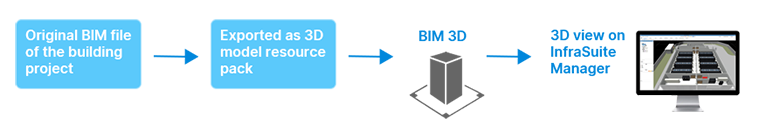
BIM 3D Module |
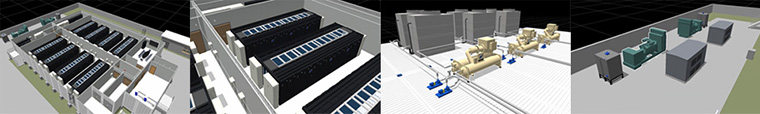
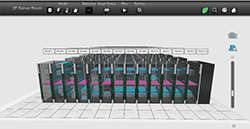
The BIM 3D functional module of InfraSuite Manager applies BIM technology to provide a 3D visualized platform. Compared to a traditional 2D layout, BIM 3D provides datacenter managers with realistic and interactive scenes and a more intuitive UI interface that greatly improves the user experience.
Delta's BIM 3D functional module applies the standardized and parametric 3D modeling technology widely used in the market. Through its own computing system, it transforms the complicated information of the traditional 2D graphic design into a more intuitive and intelligent 3D interface.
Advantages
- Integrates the existing 2D SCADA and provides an intelligent and immersive 3D visualized layout.
- Facilities and cameras can be integrated into BIM 3D, making it convenient to view their real time status and camera live stream videos.
- By operating the UI with a mouse, users can zoom in and out of the screen, change the viewing angle, and further check the details of each scene in the server rooms.
- Provides far, medium and near area scene operation modes so that users can switch scenes from site, building, rooms and zones.
- Information contained in BIM files can also be integrated into the BIM 3D operation interface.
- BIM 3D can be used alone or with 2D SCADA, to instantly grasp the device status and real time values of the computer room.
Implementation Process
Operation Interface
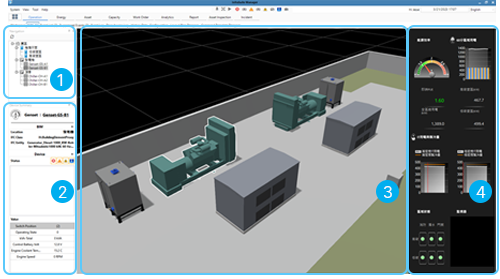
(1) Navigation (2) Device Summary (3) BIM 3D (4) 2D SCADA
Monitoring and Management
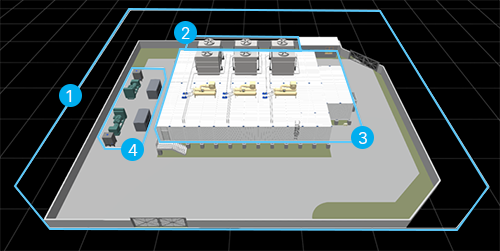
(1) Large-scale Scenes: Region, zone, building, and more.
(2) Small-scale Scenes: Server room, power room, office and more.
(3) Event Area: Highlights the areas where abnormal events occur.
(4) Monitored Device: Status and real time data of monitored devices, e.g., UPS, sensors, cameras.
|
|
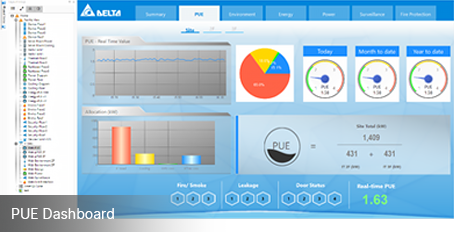
PUE Energy Module |
Sufficient power supply is the foundation of consistent uptime for numerous servers, network devices and infrastructure facilities in data centers. However, this comes with the tremendous power consumption that has always been a critical challenge for data center managers. Therefore, how to reduce power consumption while maintaining the best availability of data center operation is a critical mission of the management team. The Energy Management Module is designed and developed for resolving this issue.
PUE (Power Usage Effectiveness) is the indicator for measuring power consumption. It is reported from DIGITIMES that, if the PUE can be lowered by 0.1 in a 100KW data center, there will be approximately US$10,000 electricity costs saved annually. It is undoubtedly important for data center managers to make their best efforts to manage energy consumption effectively.

The Energy Module contains the functions of energy measurement, PUE calculation, electricity tariff formula, and historical data analysis. In addition, it includes organizational energy classification and management mechanisms. With time and experience operating this system, datacenter managers develop greater agility for managing energy consumption. This module can transform energy consumption data collected from power meters, UPS (Uninterruptible Power Supply), PDU (Power Distribution Unit) and environment detectors into dynamic charts and graphs, including line charts, bar charts, and pie charts based on user preference.
Electricity Fee Calculation
- The collected power meter kWh data can be used for electricity fee analysis. The electricity rate formula can be flexibly set and then the electricity bill can be generated according to the specified time zone.
Energy Usage Analysis
- The tariff formula can be designed according to the time period, and each organization can individually set its own electricity fee formula.
- Power and energy analysis is based on electricity meter or organization.
|
|
Incident Module |
When an event occurs, the Incident Module can help data center managers restore equipment to normal operation with the best repair quality in the shortest possible time, reduce business losses of the enterprise or organization, and ensure the best operation and maintenance efficiency and service continuity.
- The Incident Management functional module is a management platform that was developed based on ITIL-defined processes and stages.
- It helps users to quickly record and classify incidents that occur in the data center, assigning tasks to appropriate handlers and increasing failure elimination efficiency.
- The graphs and trend charts make it more efficient to track the incident/failure elimination status.
- The historical records of these processes can be referenced if there is a similar incident/failure that occurs again in the future.
|
|
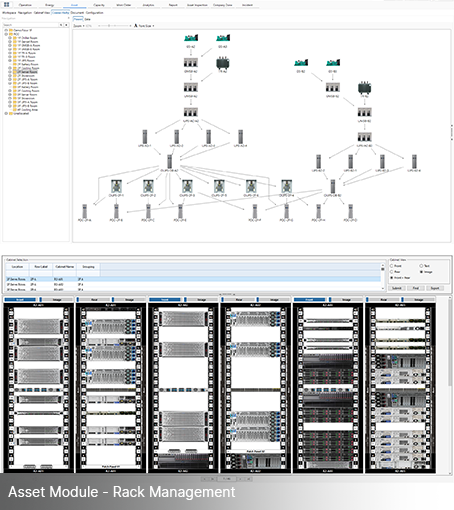
Asset Module |
Asset Management is the core function of DCIM management activities. In a datacenter, there can be thousands of assets including infrastructure facilities such as power and cooling. There are also IT assets such as servers, storage, networks, and others. Constantly tracking and monitoring these assets are important tasks for datacenter managers. In the case of assets without proper management, it often leads to a higher mean time to repair (MTTR) and lowering the availability of the data center’s equipment.
The Asset Management function module provides an interface that is easy to use and monitor, allowing the datacenter managers to classify and inquire about detailed information on power, cooling, network, and servers. It can also generate a power path diagram and network topology according to the device’s downstream relationships. The simple, real-time and easy-to-use operation platform enables users to quickly and clearly identify the status of the power and IT assets.
Advantages
- Quickly classify and search any asset in the system.
- Export and import asset information from Excel files for batch applications.
- Document management reserves specifications, manuals, purchase orders, OI, and others in the system.
- Conduct asset expiration analysis and rack power ranking analysis.
Rack Management
Well-designed rack front and rear views make it easier for datacenter managers to quickly and clearly get device locations and capacity status at a glance.
- Racks can be grouped as rows, islands, rooms or sites.
- Rack IT devices (e.g., servers, blade, switching hub) and power devices (i.e. PDU) can be displayed as images or texts.
- Provide a cabinet view and export the result as an excel file.
Device Relationship Analysis
- Power Port:
Display the relationship between power supply, power conversion and power usage devices. Analyze upstream and downstream equipment for failure impact analysis. - Data Port:
Display the relationship between network, patch panel and terminal devices. Select a network device to list the related connection devices.
3D Visualization
This function can automatically generate a 3D view according to the floor plan design, and can perform operations such as cruising, rotating, zoom in and out.
 |
 |
 |
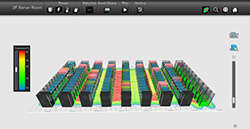
- Rack Power Usage:
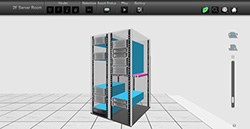
The rack power load and design rating are counted and display different color alarms to warn about current rack power consumption. - Rack Detail:
The 3D rack detail view lets the user know the location of actual assets in the rack, which can be used to check whether they interfere with each other. - Temperature/ Humidity:
Collect the inlet air temperature and humidity of the rack, and display different alarms in different colors.
|
|
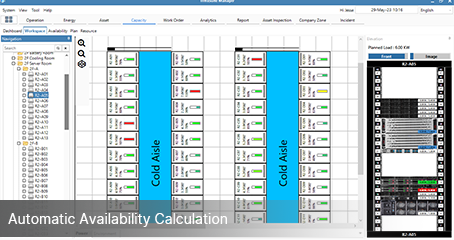
Capacity Module |
The Capacity Module allows data center managers to plan for the future more effectively through the use of detailed data on rack space, weight, network, power and cooling capacity in the data center. For example, Capacity Module helps data center managers evaluate resource consumption, making it easier for them to plan and decide on the future allocation and most suitable installation locations for IT devices.
Advantages
- Calculate the capacity of rack weight, space, power, socket and network usage. Analyze available capacity according to room and rack.
- Recommend the optimal placement of new IT equipment based on the existing configuration.
- Combine the plan with the current capacity usage to display the planned capacity usage status.
- Provide organizational resource budget and allocation process.
Rack Management
- Calculate the remaining rating power, weight and U-space for each rack.
- Display the current power consumption on the rack component.
- Display the related color for the assigned temperature/ humidity sensor on the rack component.
|
|
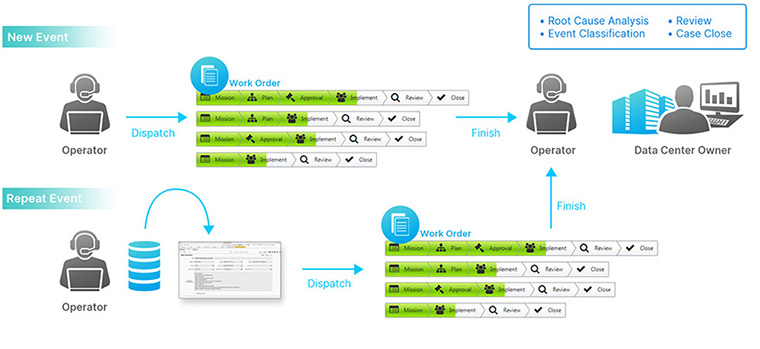
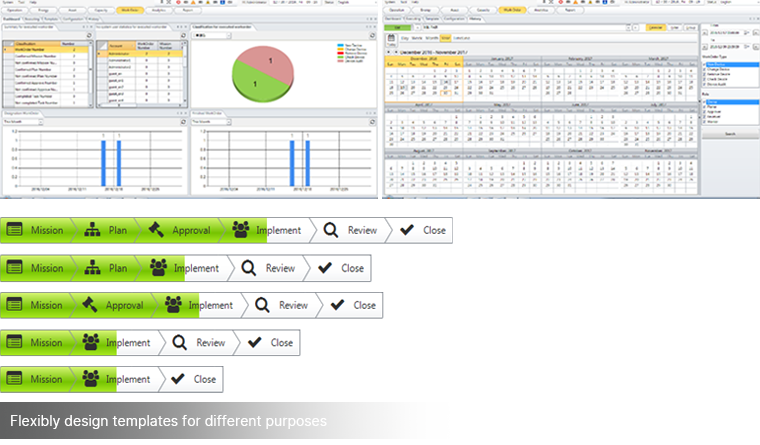
Work Order Module |
The Work Order Module provides a highly customizable platform that enables users to design work order templates for different management purposes. Different variables such as names, types, priority, schedule, roles of tasks can then be set by the administrator. This helps users not only simplify and integrate the process of change management, but also extends the life cycle of data center operation.
Advantages
- Design customized process templates for various types of work flow.
- Provide an all-in-one platform for a more convenient signing and approving process.
- Flexibly design templates for different purposes.
- View on a calendar for more convenient task management.
- Provide dashboards for statistical work orders.
- Schedule, event trigger, or manually trigger work orders.
- Upload files to the specified work order template in advance, such as operation instructions, equipment specifications, maintenance manuals, and more.
|
|
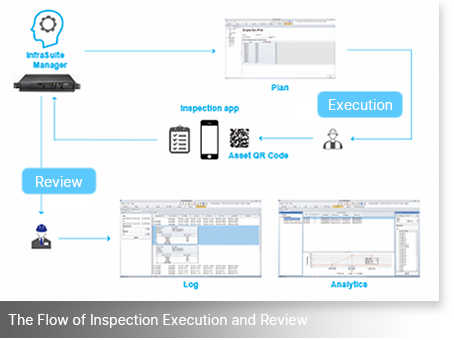
Asset Inspection Module |
The Asset Inspection Module can be used with a user-friendly mobile app which makes it smarter and more efficient for an inspector to complete his/her inspection process. Customizable templates can be designed for different types of assets. Users can also upload photos of the inspected assets to InfraSuite Manager. Unique QR codes of each asset can be generated by the system, making tasks more intuitive.
|
|
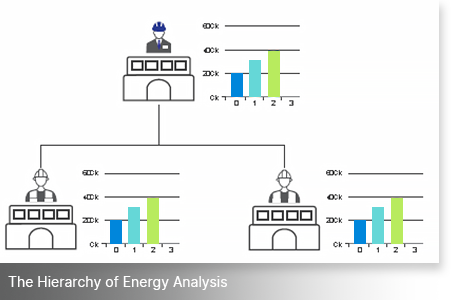
Analytics Module |
The Analytics Module is not just for a single site but for the entire organization. The electricity tariff formula can be customized for each department. In terms of detailed energy analysis, Delta offers diverse scenario analyses, including energy usage KPI, comparison, energy combination analysis, abnormal energy usage ranking, and energy usage estimation. In terms of asset analysis, it can provide rack power ranking by average and peak power for organization, asset expiration report and asset inspection analysis.
Machine Learning Function
Because each project is different in configuration and application, the existing EMS3000 historical database (1 year) must be used for the learning materials to model and predict.
- Predict Target Trends
To predict the target trend for the next month, select a target such as total power trend, network traffic or water consumption. The trend screen shows the predicted and actual curves and provides an RMSE error for reference. - Forecast Capacity Expiration Date
Assist the data center operator understand when the current power and cooling capacity will be fully occupied. Based on this, you can arrange to purchase new equipment or build a new datacenter in advance.
|
|
Smart Energy Module |
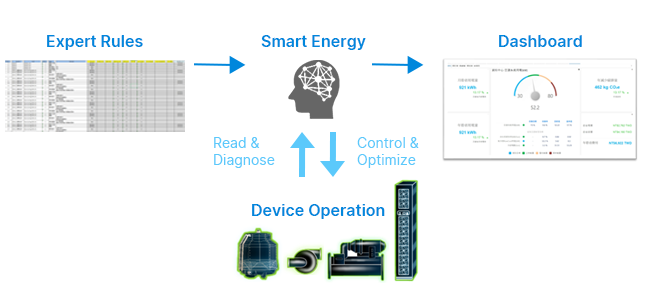
The Smart Energy functional module of InfraSuite Manager is designed for optimizing the power consumption efficiency of the data center. System diagnosis is carried out based on the information collected from devices to optimize the cooling system’s operation. This helps the data center to achieve the goal of overall energy saving and carbon reduction, and helps enterprises move toward environmental sustainability.
Advantages
- The Smart Energy functional module of InfraSuite Manager visualizes and graphs the energy consumption information of the data center, and conducts a comprehensive check on the energy consumption status and estimated carbon emissions of each piece of equipment in the data center. By using the collected historical data, analyzing it through the logic of the built-in expert system, and combining the years of experience of device professionals, the intelligent energy-saving simulation calculations for the data center can be carried out.
- Users can receive suggestions for improving the power consumption of the data center, identify if there were issues coming from human operation or any other factor that caused the efficiency of power devices to decline. Furthermore, the system can analyze how the device configuration should be adjusted to improve power consumption efficiency.
- The built-in expert system can implement precise control of dynamic parameters for devices through pre-set operating rules. For example, when excessive energy consumption of the cooling system is detected, the appropriate operating parameters or control mode can be precisely adjusted through the expert system mechanism.
- This functional module handles complicated measurement processes for data center managers, and also provides energy consumption indicator dashboards and trend charts of the improvement.
Architecture
Features
- The independent expert system can be operated on the same host or independently.
- Automatic energy saving diagnosis.
- Precise dynamic parameters control.
- Automatically correct the control process after the diagnosis with information transparency.
- Cover the main issues of the cooling system and replace the need for cooling experts.
- Built-in cooling system energy-saving diagnostic indicators, including COP, EER, Approximate Efficiency, Heat Balance, Wet Bulb Approach Temperature, Evaporator/Condenser Approach Temperature, Thermal Comfort Index, Enthalpy Value, Water Pump Efficiency, and more.
- Dynamic baseline analysis: Calculate the chiller power consumption baseline curve from historical data and analyze the dynamic upper and lower limits.
- Abnormality prediction: Based on stability and consistency, it can reflect the status of devices and the correlation of multiple sensors.
Product available regions :
|
| Request A Quote |


